Locating a neighbourhood watch in Singapore
21 Sep 2017Lab Assignment #3 for my high school GIS course.
A client wishes to identify areas and clusters of crimes rates in Singapore using GIS, in order to access the feasibility of initiating a grassroots project on urban neighbourhood watch at some of these areas or clusters.
Summary of Considerations
Type of crime is to be considered as not every single crime would be relevant to a neighbourhood watch. According to Bennett et al. (2008), the majority of neighbourhood watches worldwide focuses on robberies. However in the case of Singapore, the Neighbourhood Watch Groups (NWGs) established do look at many other types of crimes, including unlicensed money lending (UML) and harassment. Hence, all type of crimes should be analysed.
NWGs will also need sufficient police support, as while they can act as their eyes and the ears, all crime cases will eventually have to be escalated in good time before things can get out of hand. The population in the area will also be looked at, since the strength of the NWGs is drawn from the resident population.
Spatial Analysis

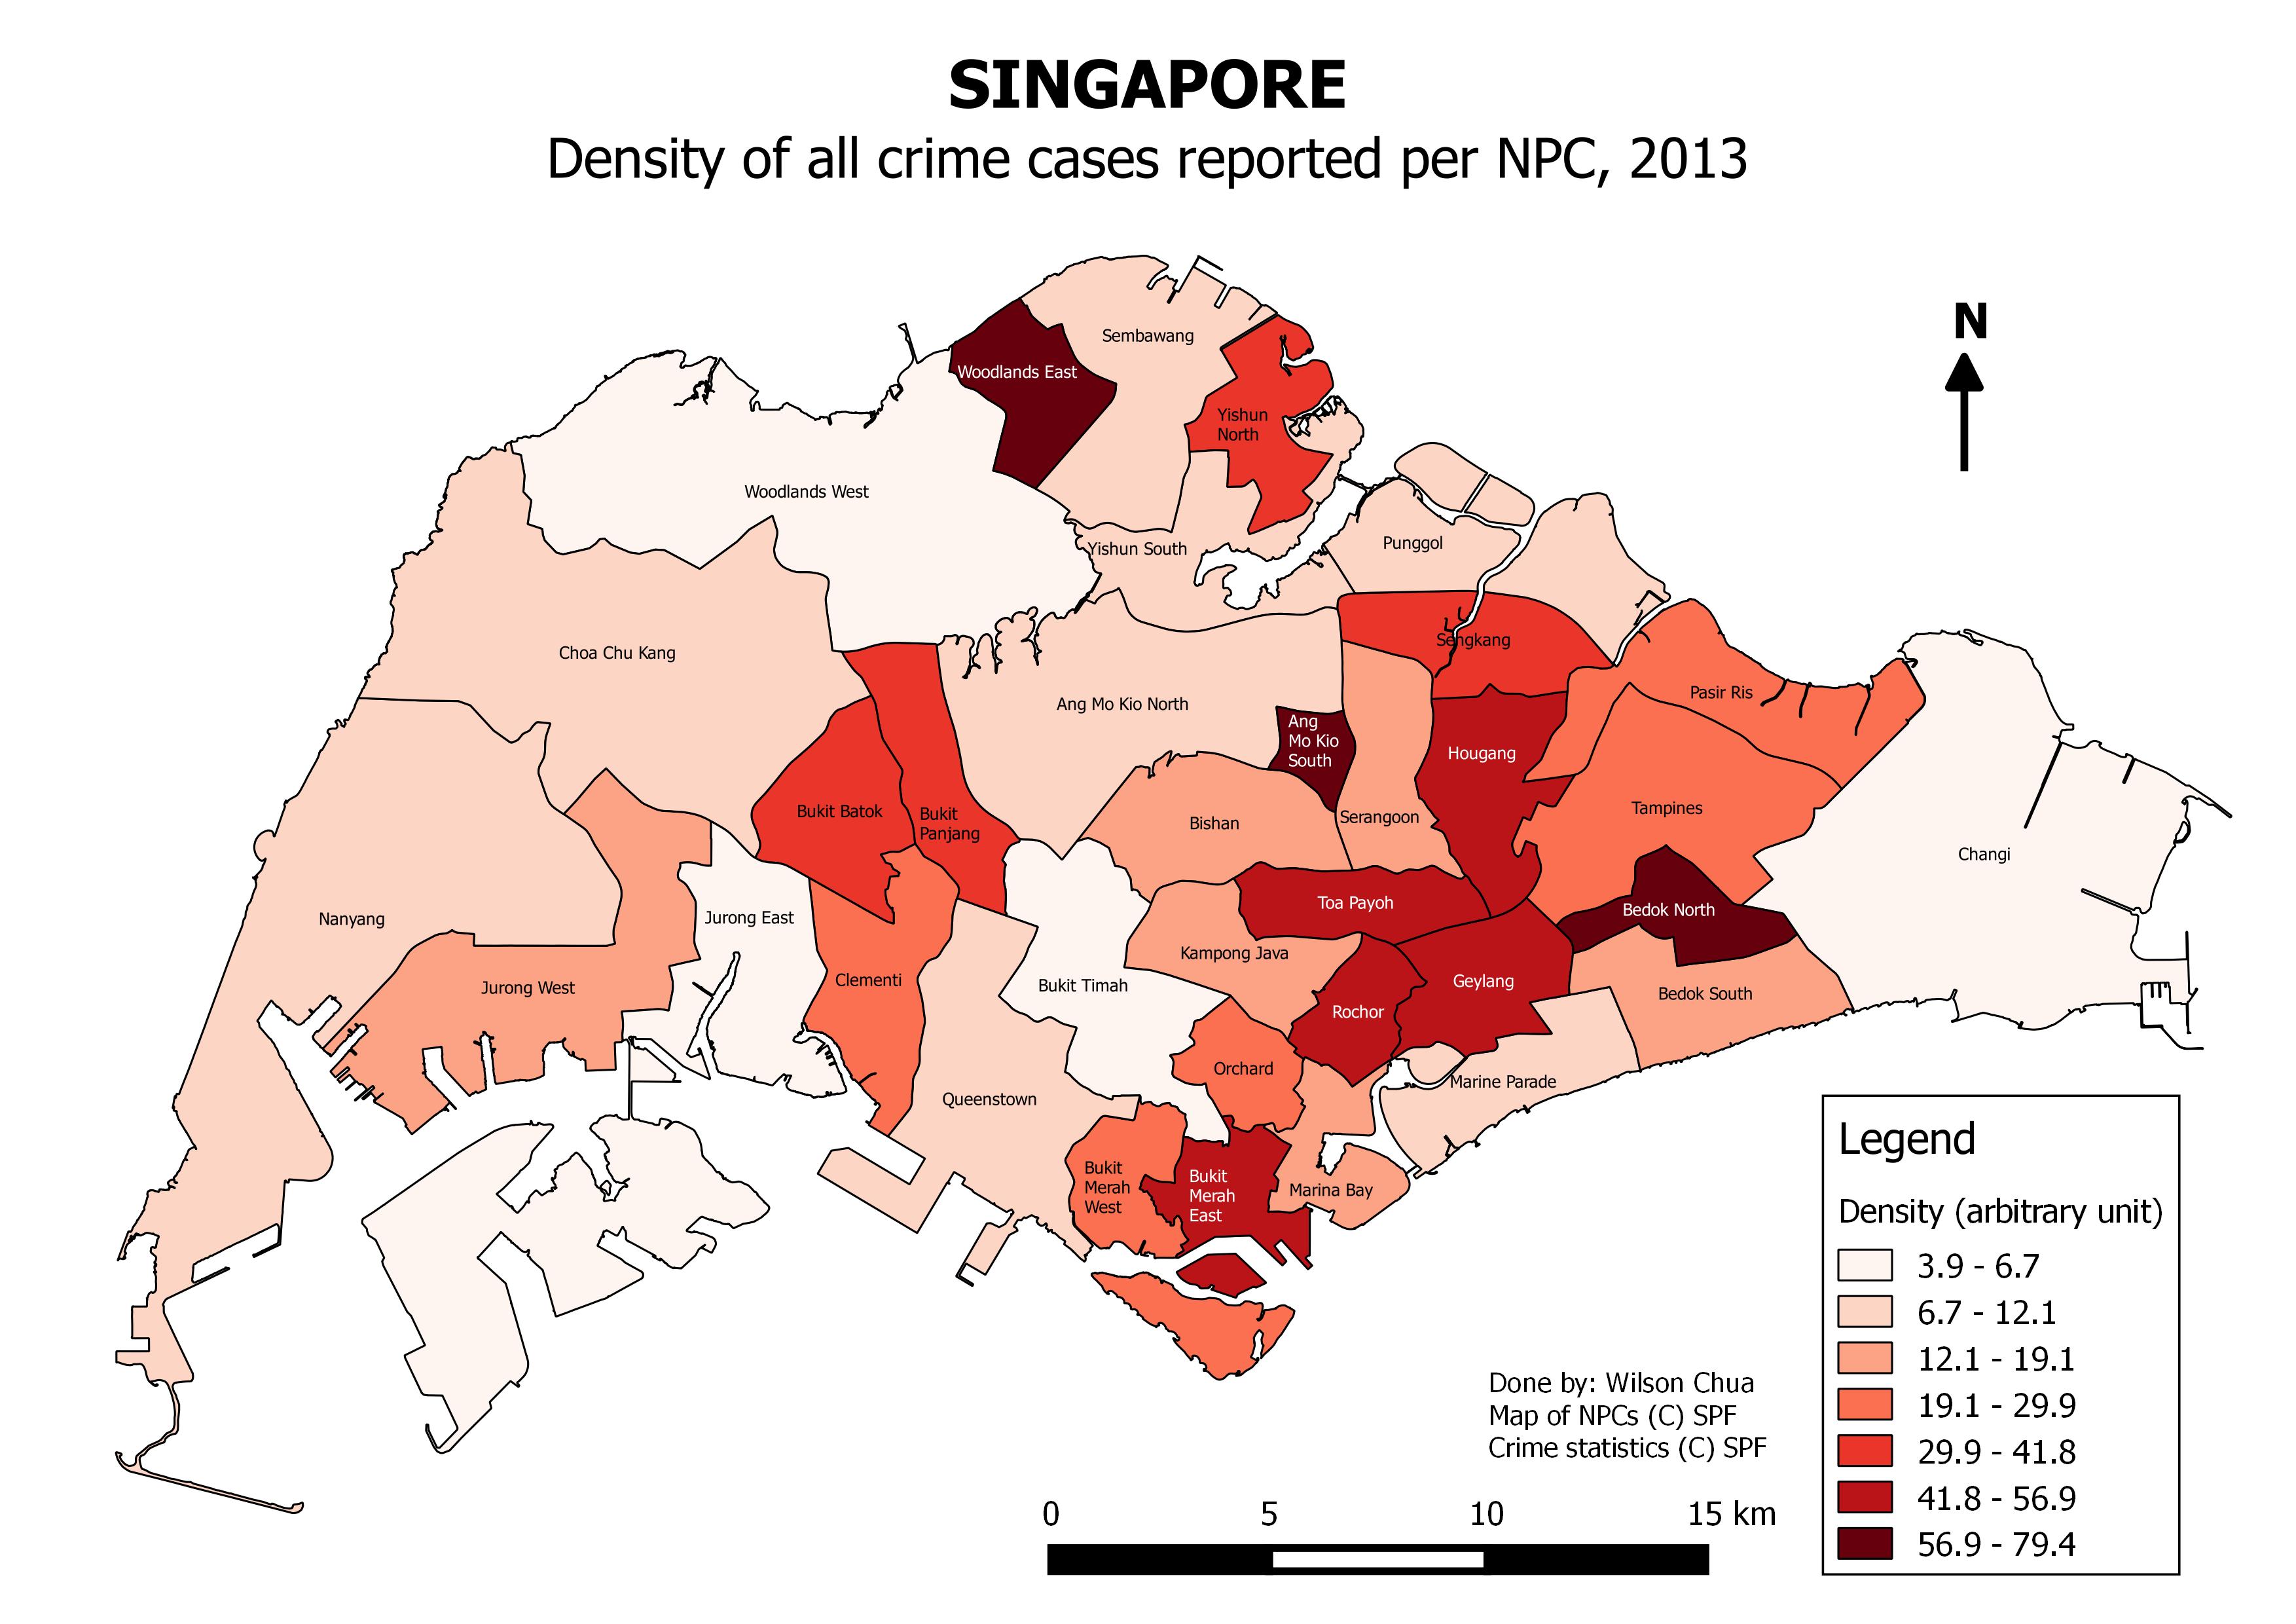
The first map done, featured above, is a chloropleth map that showcases the density of crime cases for each planning area. The density is based off an unweighted total of all crime cases, which means that certain types of crimes would have contributed more towards this total, such as harassment cases. This was done in order to obtain a general sense of the crime hotspots in Singapore, which would be somewhat independent of the crime type.

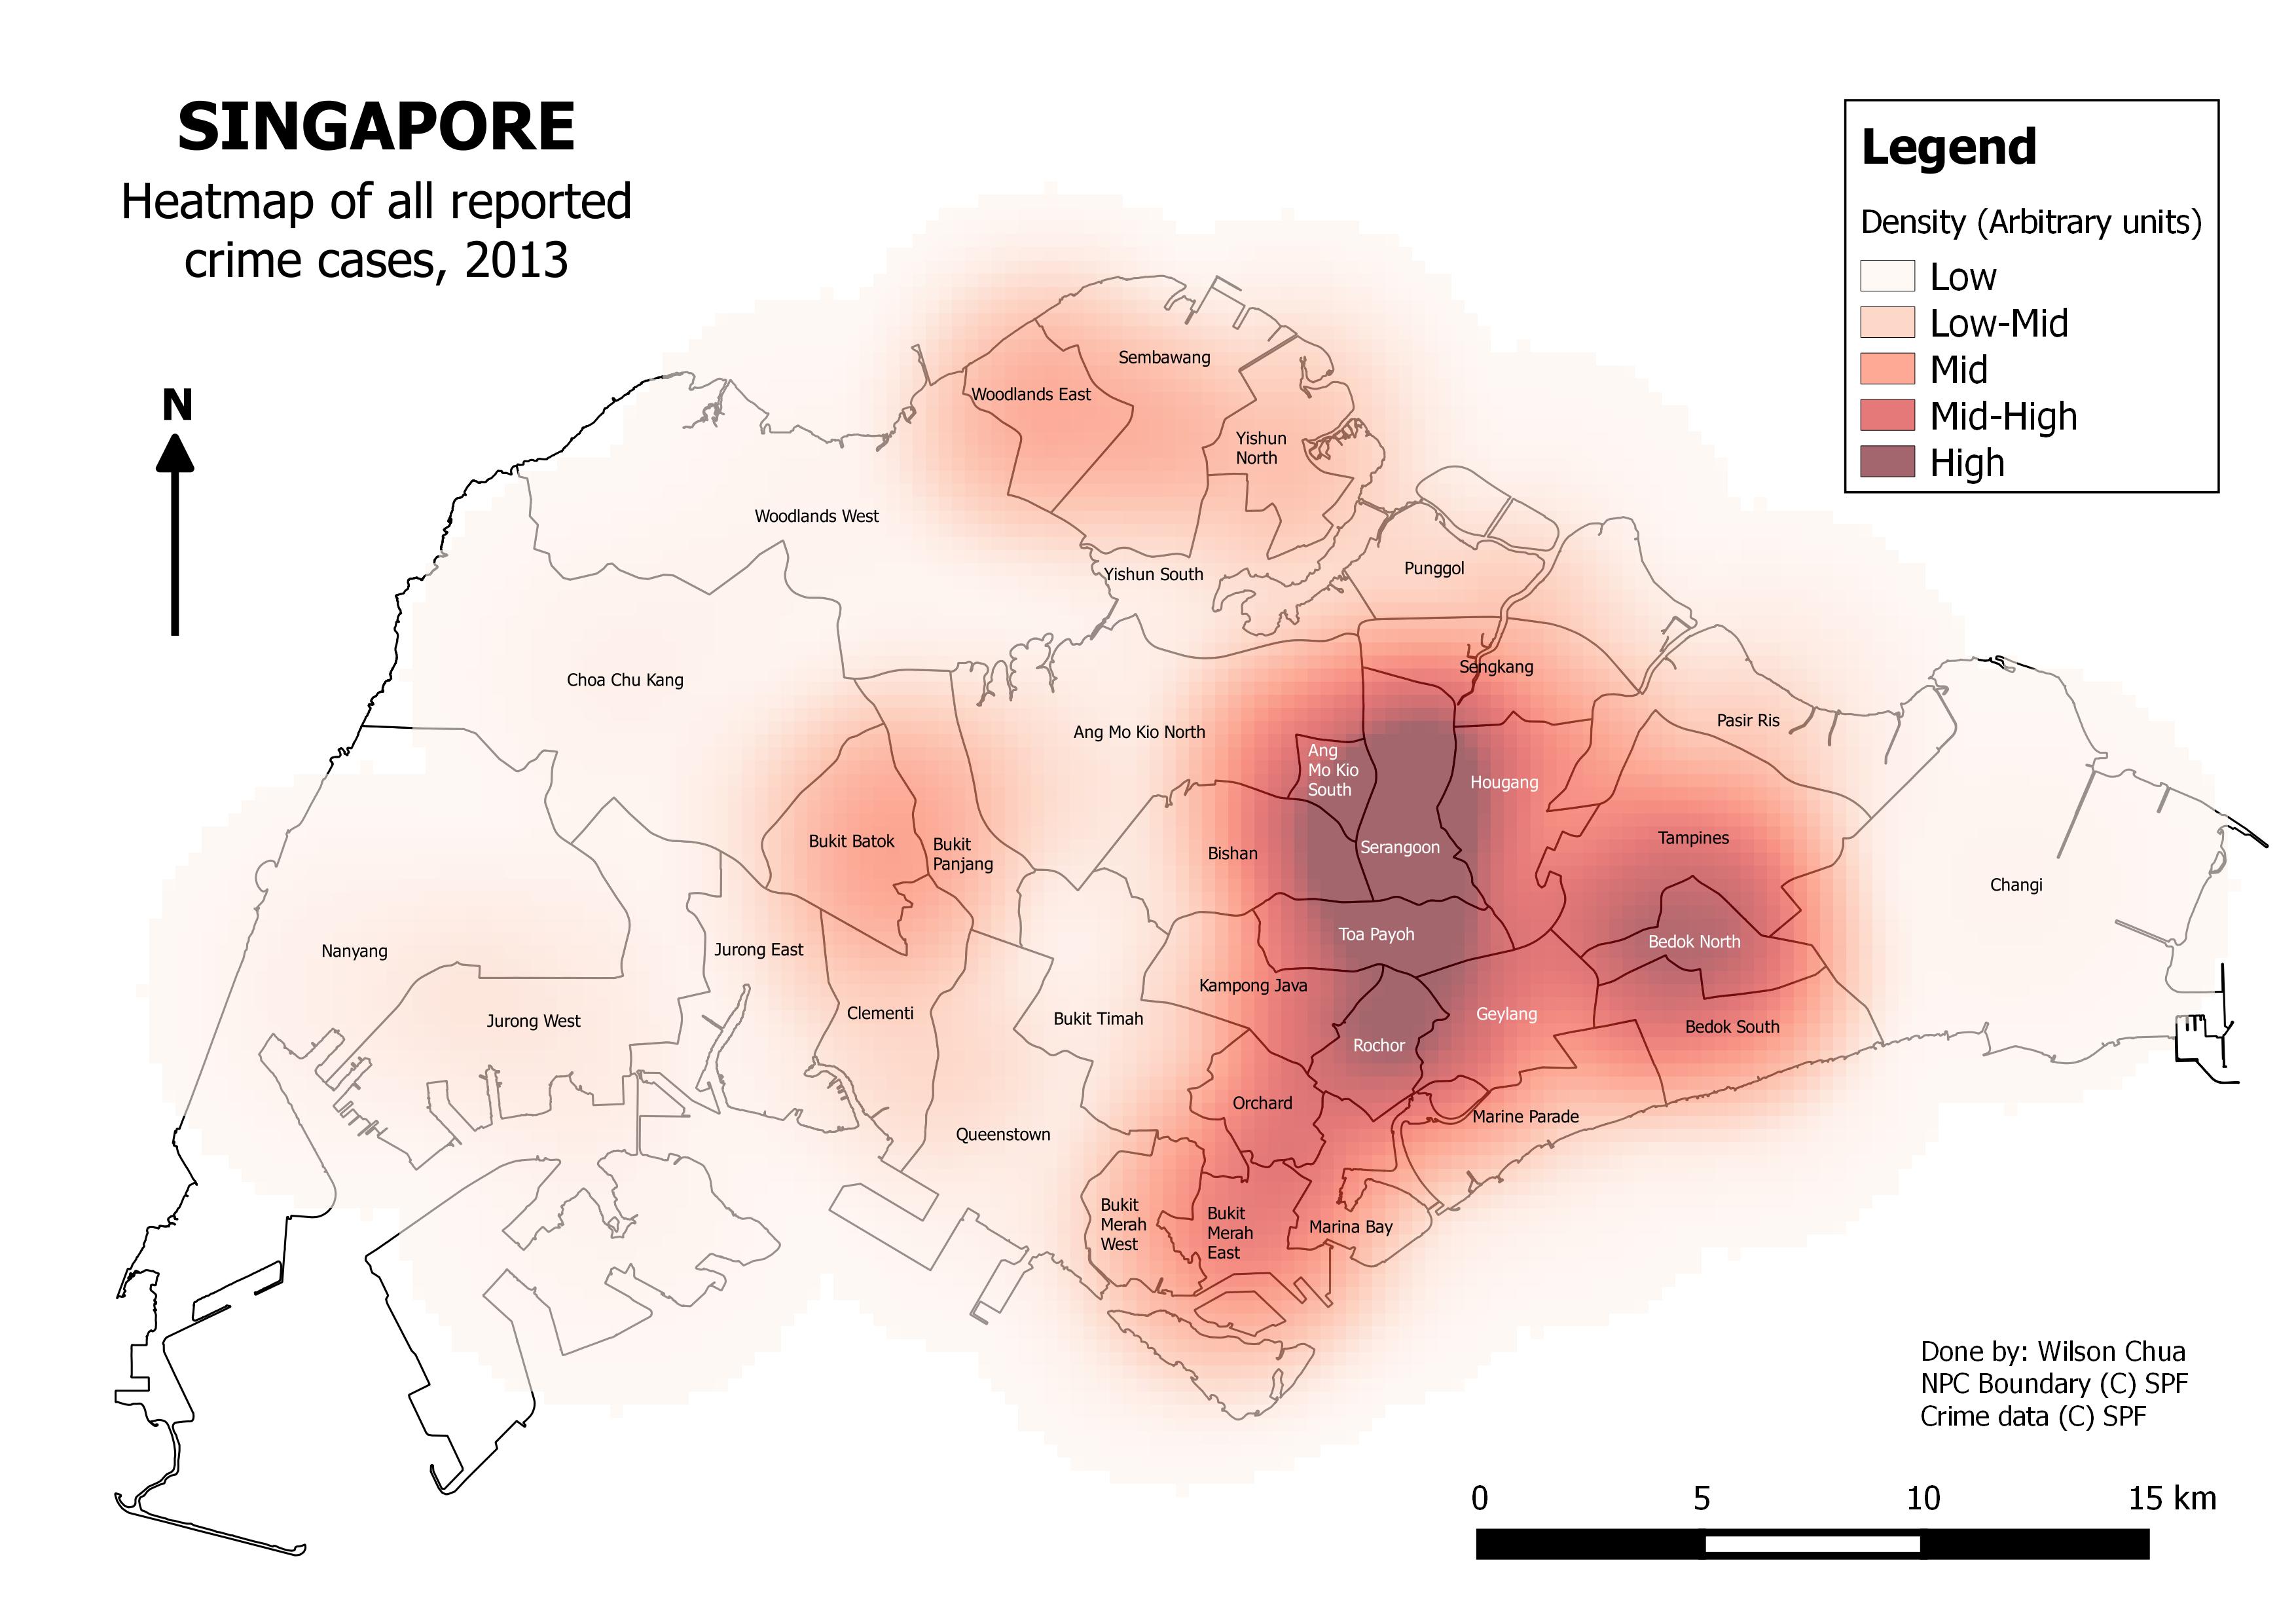
A weighted heatmap of the crime cases, which however does not discriminate well for specific localities within planning areas due to the utilization of the polygon centriods as the centre. This effect would have been diminished had the geometries of each NPC boundary been similar, but in reality each NPC boundary has different shapes and sizes. Nevertheless it can still be acceptable to first consider the chloropleth map to identify clusters, and then to use the heatmap to delimit hotspots. From the above maps, the Central-Eastern region of Singapore as well as the Woodlands Planning Zone clearly appear to have higher crime rates.


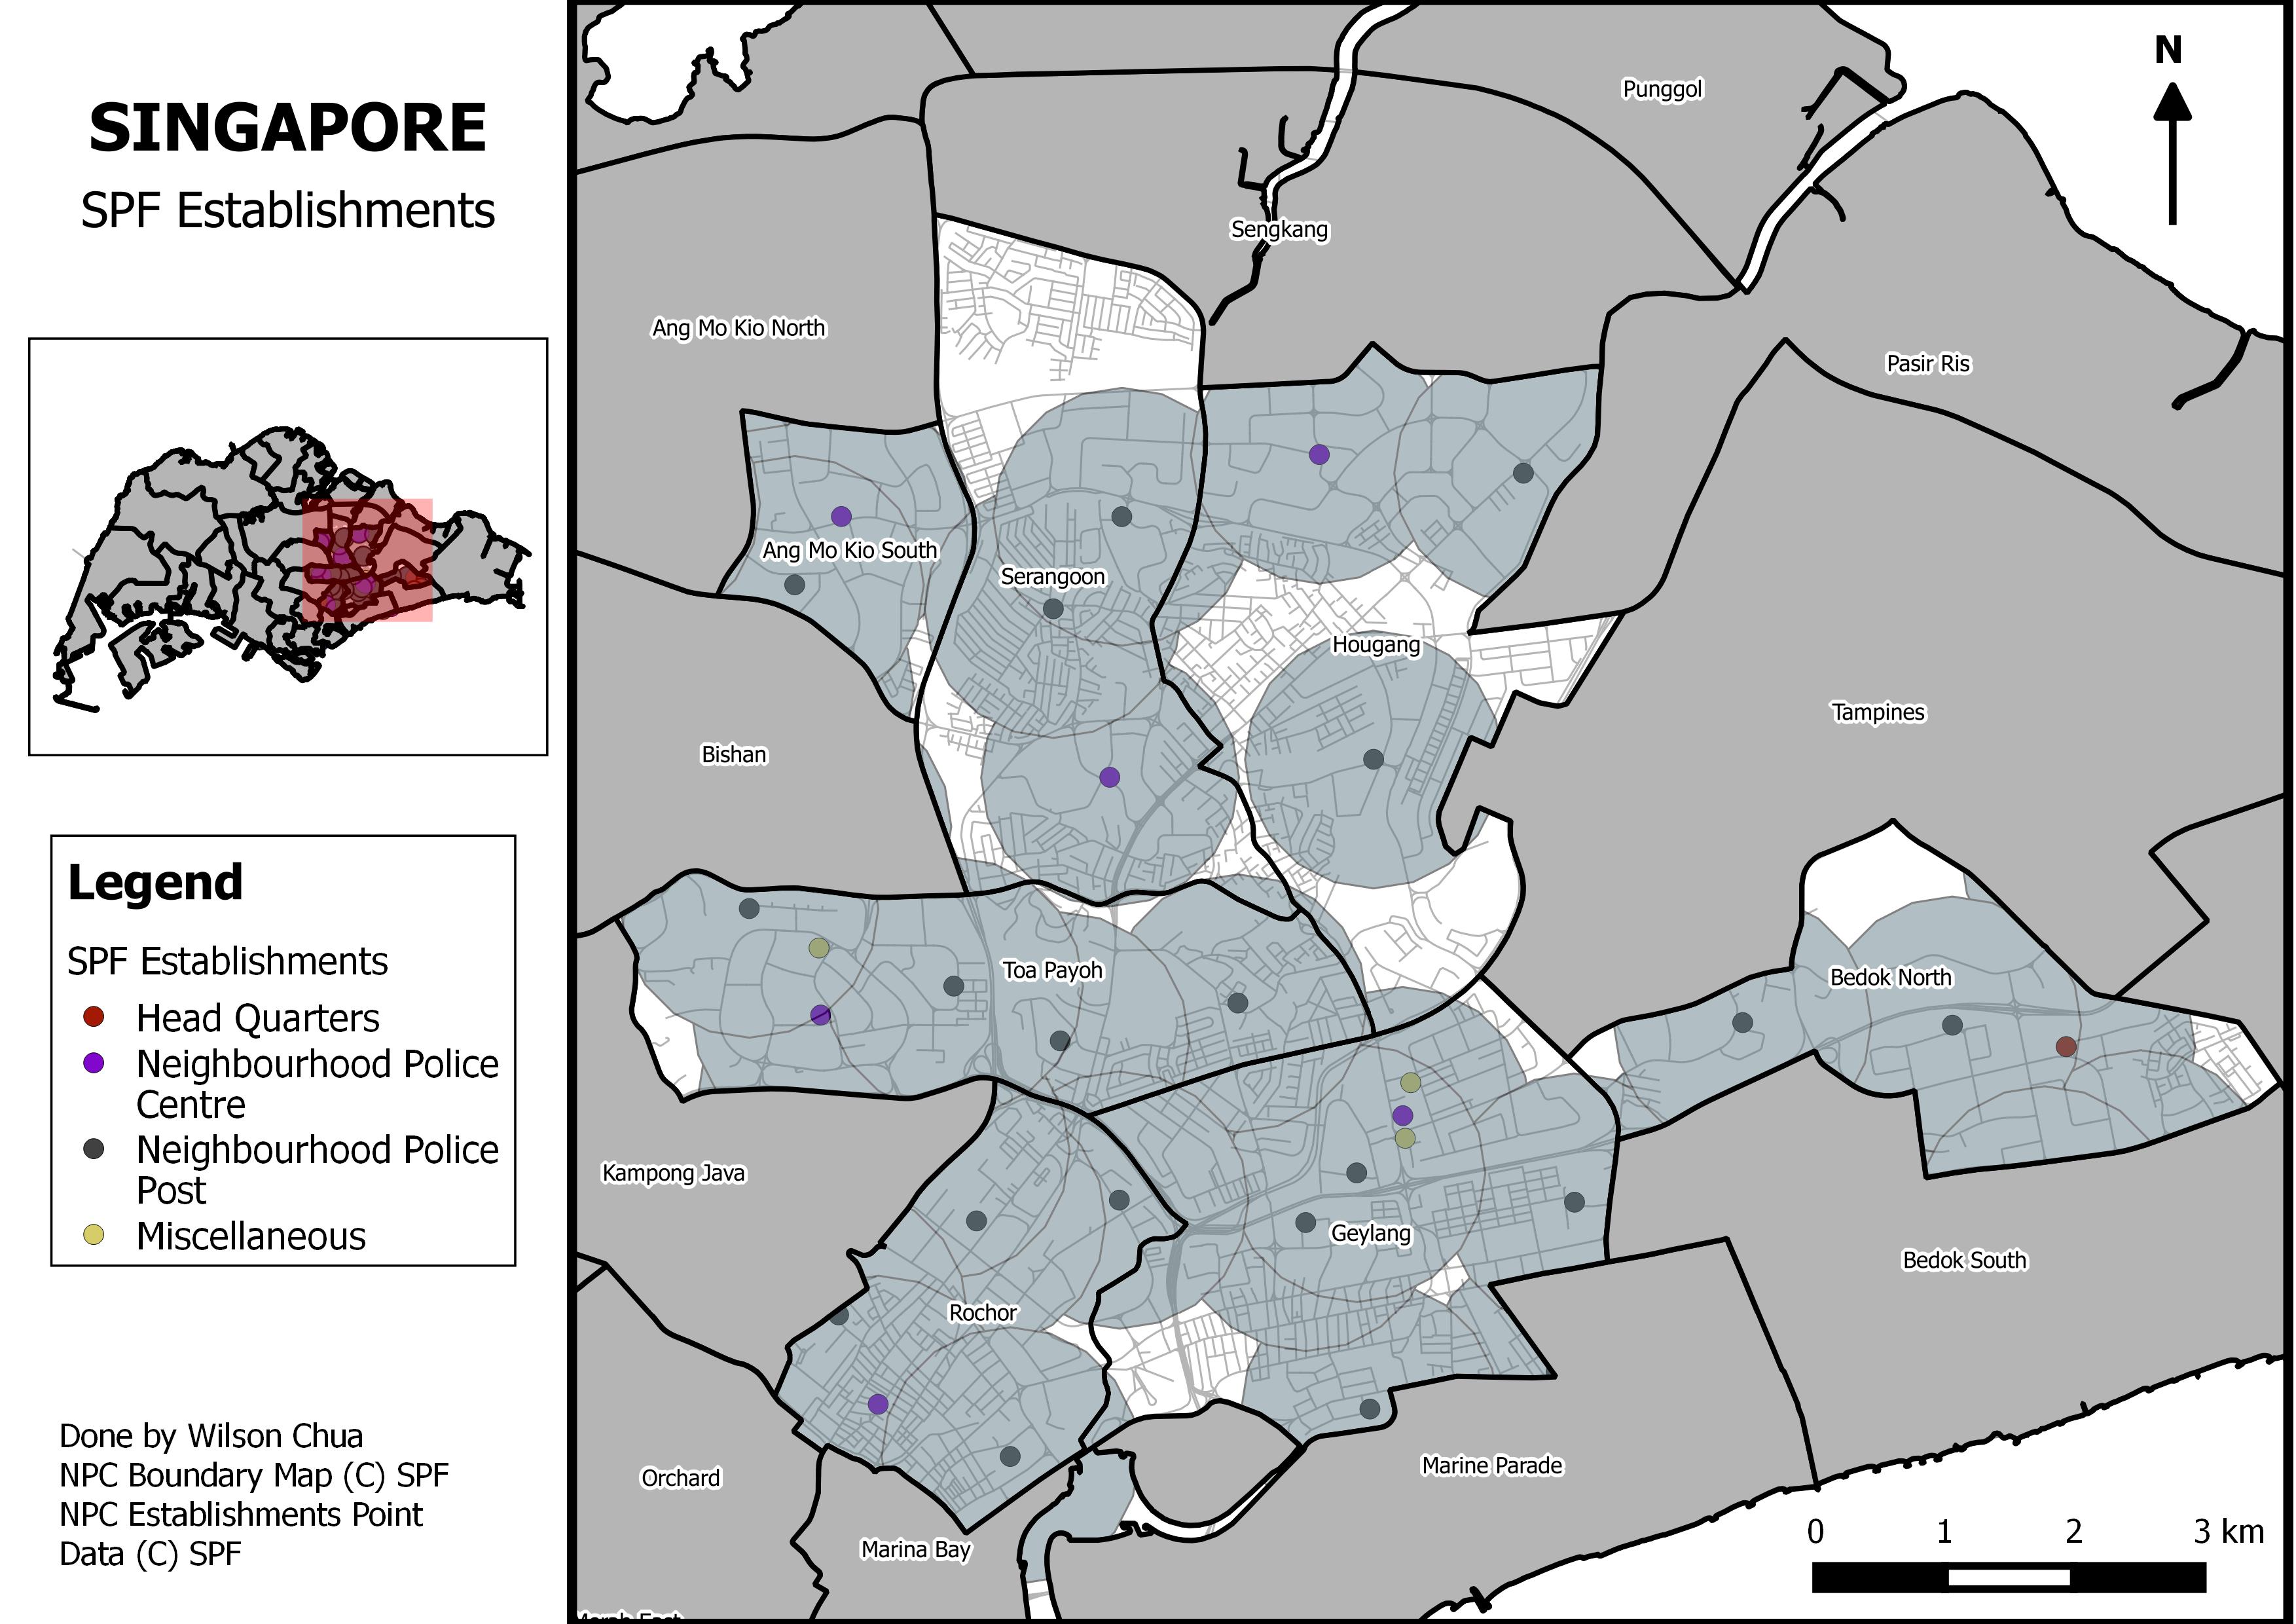
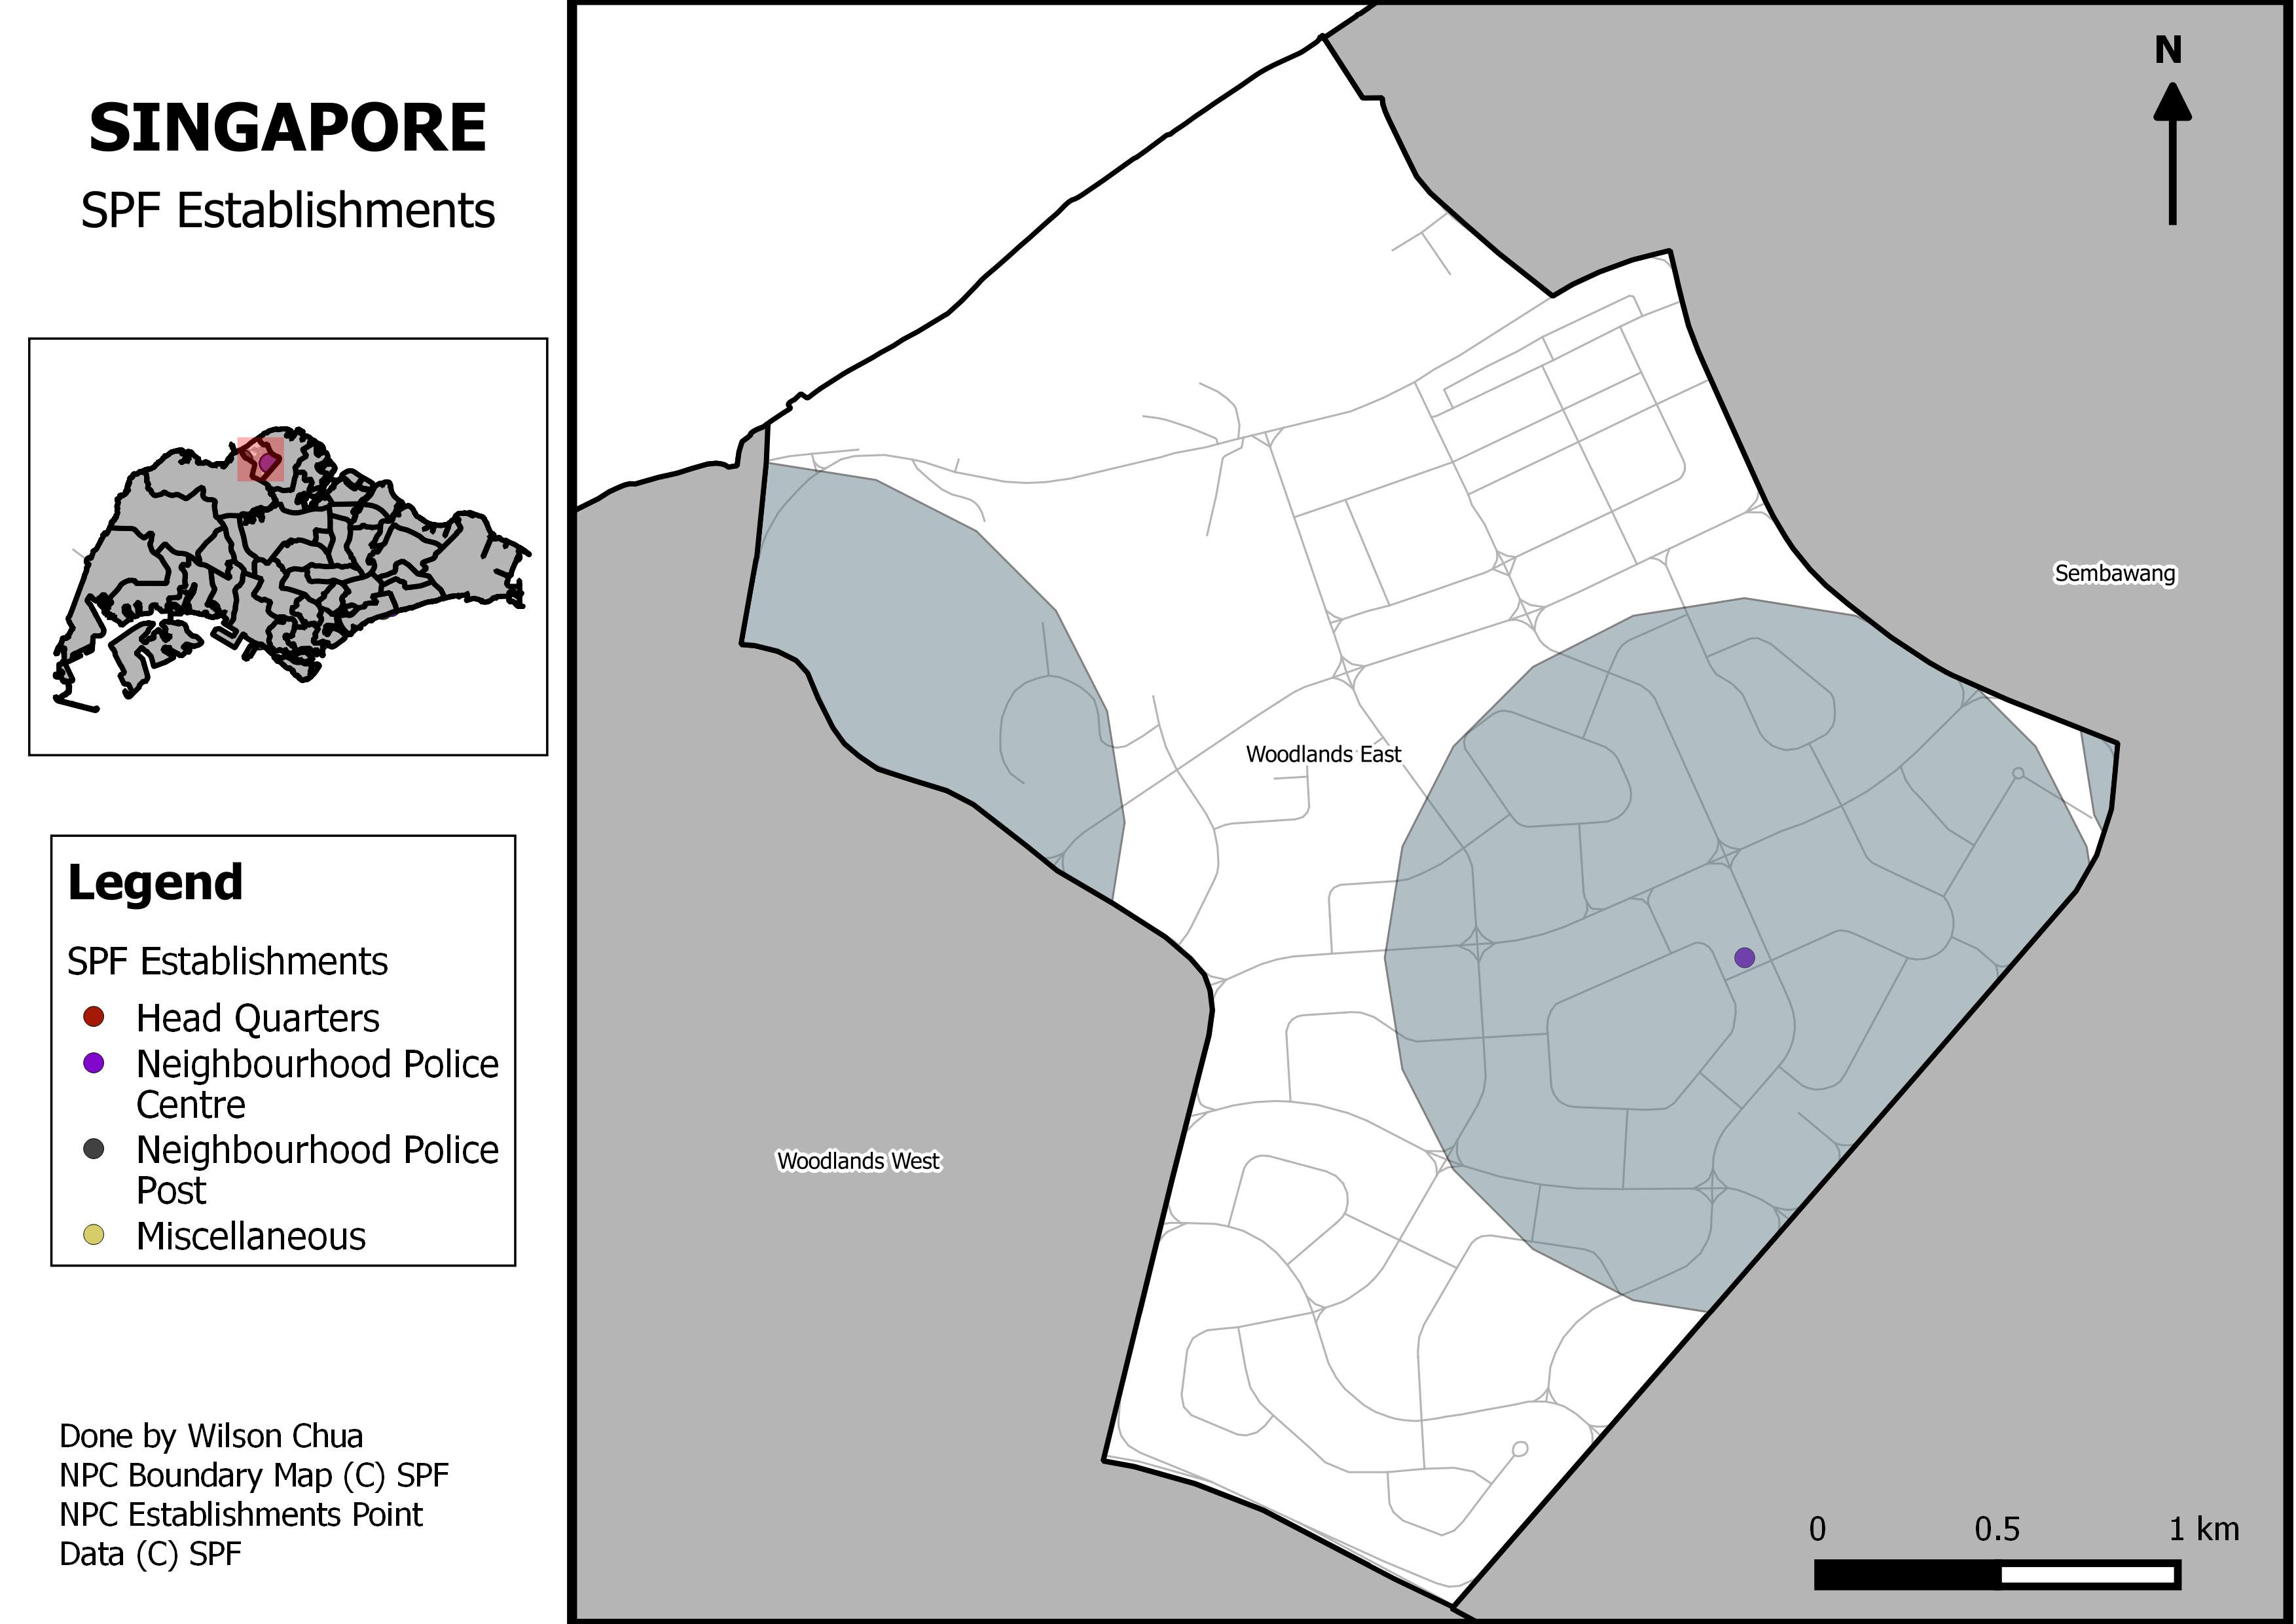
Subsequently the Singapore Police Force (SPF) Neighbourhood Police Centres (NPC) and Police Posts were mapped for the hotspots to identify areas that would have sufficient local police support for the NWGs. Buffer zones of 1km were used to visualize the reach of the police centres and posts.
Population Data
| NPC Boundary | Constituent Subzones | Population |
|---|---|---|
| Woodlands East | North Coast, Midview, Greenwood Park, Senoko West, Woodlands East, Woodlands South | 181910 |
| Bedok | North Kaki Bukit, Bedok Reservoir, Bedok North | 154460 |
| Ang Mo Kio South | Cheng San, Chong Boon, AMK Town Centre, Townsville | 88190 |
Conclusion
In Central-Eastern cluster both Ang Mo Kio South and Bedok North should be focused due to them being in the highest defined class in the density chloropleth map. Hence a NWG effort, if it is to be planned at the NPC level, should be prioritized in either of these two areas. Out of these two NPC boundaries, Ang Mo Kio South would be preferred due to the slightly greater coverage offered by the SPF establishments in the area.
However Woodlands East is another NPC boundary with high crime density, and there is a large resident population in the boundary, making it another feasible candidate to be the locale of a NWG.
References
Bennett, T., Holloway, K., & Farrington, D. (2009). The effectiveness of neighborhood watch. The Campbell Collaboration Library of Systematic Reviews, 18. Retrieved from https://www.campbellcollaboration.org/media/k2/attachments/1049_R.pdf
Ministry of Home Affairs - Singapore Police Force. (2015). Overall Crime Cases & Crime Rate [Data File]. Retrieved from https://data.gov.sg/dataset/overall-crime-cases-crime-rate
Ministry of Home Affairs - Singapore Police Force. Singapore Police Force NPC Boundary [Data File]. Retrieved from https://data.gov.sg/dataset/singapore-police-force-npc-boundary
Ministry of Trade and Industry - Department of Statistics. Resident Population by Planning Area, Age Group and Sex, June 2011 (Gender) [Data File]. Retrieved from https://data.gov.sg/dataset/singapore-residents-by-planning-area-age-group-and-sex-june-2011-gender